Knowledge trajectories and role patterns / Trayectorias de Conocimiento y patrones funcionales
What are trajectories and when may they be helpful?
Trajectories offer a multidimensional taxonomy emphasizing the temporal aspect of knowledge sharing. Introducing trajectories in the SISOB workbench enriches analysis possibilities for the knowledge sharing case. As a transient format trajectories hold information on actors, in this case researchers and institutions, as well as artifacts, here publications and their attributes. Attributes like geographic position or different types of actors, as suggested for career trajectories, help identifying knowledge spillovers, if they are followed over a period of time. Following attributes exploits the tacit nature of knowledge to find knowledge trails. Searching, sorting and selecting are basic tasks on trajectories. Trajectories can subsequently be converted into a number of 2-mode-networks for further analysis.
Trajectories are lists of entries (figure 31). Entries hold information about a researcher connected to an institution in one year. Researchers are identified by a number, their initials and name. Research topics and a list of papers authored in the given year complete an entry.

Figure 31. Since initials and names are not necessarily unique, researchers are identified by ID. Entries exist per researcher, institution and year.

Figure 32. Keywords are extracted from abstracts of papers.
A paper has a title, an abstract, a list of authors and of keywords. Keywords have been extracted from the abstracts with the help of the KEA (Keyphrase Extraction Algorithm) (figure 32). Topics are an accumulation of all keywords.
Missing years or institutions are roughly estimated, if possible. Missing dates are chosen from the time span of entries before and after the given entry, assuming a chronological order. Institutions are extracted from publications or it is assumed, that they did not change. Entire missing entries are filled with CV information of the preceding year. Even with these corrections, empty fields in the trajectory cannot be avoided, where there is no information to base estimation on.
Converting trajectories to networks
It is possible to convert trajectories to 2-mode-networks in the Pajek .net format via the TrajectoryToNet converter in the SISOB workbench for further analysis. The following networks can be generated:
- Author-Institution network
- Author-Publication network
- Institution-Publication network
- Author-Topic network
- Topic-Publication network
- Topic-Institution network
By folding these graphs, it is possible to gain e.g. co-authorship networks on the fly.
Following knowledge is often accomplished by following the mechanisms that help spreading the knowledge. Abramo, D’Angelo and Solazzi (2011) for example looked at co-authored papers to detect knowledge spill-overs. This addition to the SISOB workbench follows the knowledge itself, concentrating on where and when it appears, leaving how it got there to further research. This can be an advantage, since it also detects knowledge transfer by less measureable routes. The actors in this scenario are R&D institutions, which give the knowledge produced within their walls a position. The knowledge is represented by topics, which are keywords extracted from abstracts of papers. Institutions publishing on these topics are mapped onto a Google map similarly to the approach taken by Bornmann, Leydesdorff, Walch-Solimenta and Ettl (2011), who showed, that highly cited papers are often centred around big cities. The GoogleMapAgent shows rise, geographic distribution and movement of a single selected topic over time on a Google map. Time slices are years. Thus, it is possible to study the lifecycle of a topic: Where it appears, how fast and where it spreads, if it tends to stick to institutions or oscillates between them and how fast and where it descends.
One goal of the tool is to examine, where topics appear for the first time. A topic does not necessarily have to have only one starting point. Either it could have spread even within the first time slice or different institutions could produce the same knowledge simultaneously. In times of globalization, public databases, Google scholar and social media, artefacts like papers are available all around the world within seconds. But knowledge can be of tacit nature and strongly bound to an actor. It would be interesting to see, if under these circumstances the statement of Glaeser, Kallal, Scheinkman and Schleifer (1992) still holds true, that “intellectual breakthroughs cross hallways and streets more easily than oceans and continents”. Eventually this agent can be used to detect typical lifecycles of topics, which could lead to the development of lifecycle patterns.
Working with an example in the SISOB workbench
The collection with geodata, which the TrajectoryBuilderSimulator provides for this workflow, is a purely imaginary collection in the format trajectory. It is compiled only for the purpose of exploring the possibilities the GoogleMapAgent provides. Therefore analysis does not lead to any valid results.
The collection consists of eighteen entries that span the four years from 2009 to 2012. It includes nine institutions located on four continents, with three of them situated in Boston, two of them situated in the south of Great Britain in order to cover distances from a few hundred meters to a few thousand kilometers. Institutions are the University of Duisburg-Essen, Harvard University, Massachusetts Institute of Technology, University of Sydney, University of Oxford, University of Cambridge, University of Zagreb, Boston University and University of Moscow. Geographic coordinates for these institutions are made available by the tool. There are eight topics to choose from (Nanotechnology, Biomolecular Engineering., Bioinformatics, Material Sciences, Neurosciences, Computergrafics, Electronic Business and Social Network Analysis). “Nanotechnology” is listed for every entry and will therefore return the full trajectory and give the most comprehensive demonstration.
Workflow
Figure 33 shows the workflow in the SISOB workbench. The GoogleMapAgent takes a trajectory provided by the TrajectoryBuilderSimulator as input. The TrajectoryFilterTime, which can be applied optionally, reduces the trajectory to entries between the years 2009 and 2012. Since the GoogleMapAgent is designed to focus on a single research topic, it is imperative for this workflow to use the TrajectoryFilterTopic to determine the topic of interest, which is “nanotechnology” for this example. The GoogleMapAgent finally transfers the information from the trajectory into the Keyhole Markup Language (kml), a XML based notation for geographic information with context or metadata, which is accepted as input by the GoogleMap-API. The result is a link to a Google map, which shows an institution-institution network for the chosen topic for every year within the selected timeframe.

Figure 33. Workflow in the SISOB workbench to depict single topic development on GoogleMap
As can be seen in figure 34, years are distinguished by the colour of their links. Naturally, institution networks for one year form a clique. These networks are folded topic-institution networks, which include only one topic after filtering. Folding away the single topic leaves a clique of institutions. Links stand for the fact, that one or more researchers at the source institution work on the same topic as one or more researchers at the target institution, but do not imply cooperation between institutions. Earlier links in terms of years hide later links. Years and institutions are listed in the menu on the left and can be selected or deselected via checkbox (see figure 35). In the years 2010 and 2012 the number of institutions involved has remained fairly constant, but institutions have changed and the topic has spread widely geographically.

Figure 34. Overviews give a rough estimation on growth and distribution of the network.

Figure 35. A close up reveals three universities in Boston to be part of the network.
A close up on the American continent (figure 35) allows for a more detailed analysis of the institutions involved in this area. Three universities in Boston are part of the network. A click on the node in the map gives the name of the institution, a click on a link indicates source and target. For example, the Massachusetts Institute of Technology has participated in research in the topic during 2009 and 2012.
Actors often fulfill a role within a given context. In the context of knowledge sharing and researcher mobility, roles which are crucial for spreading knowledge or indicate change are of interest. A role therefore is a behavior in the process of acquiring, creating and sharing knowledge. The RolePatternFilter is a new addition to the SISOB workbench designed to identify researchers, who occupy predefined roles. Since their search is automated, they can significantly shorten the process of finding interesting actors and serve as a starting point of research rather than its final result (Klamma et al. 2006).
The patterns newcomer, terminator and continuant (figure 36) have already served as such starting points (Braun et al. 2001, Wagner & Leydesdorff 2005). Braun et al. (2001) applied these patterns to neurosciences and found that newcomers and terminators attach themselves primarily to continuants when co-authoring a paper. Continuants mediate relationships between newcomers and terminators.
In deliverable D8.2 the significance of the knowledge broker role in multidisciplinary networks was mentioned. The RolePatternFilter extends the idea of roles from classical network analysis to roles, which can be derived from trajectories, especially since trajectories stress the development over time. Roles can serve as attributes to an actor.
Implemented Roles
For the SISOB workbench the patterns newcomer, terminator and continuant examined by Braun et al (2001) (originally suggested by Desolla Price & Gürsey 1976) were implemented. These patterns observe publishing behaviour and are defined within a three years timeframe. A newcomer does not publish in the first, but in the following two years. A terminator publishes in the first two, but not in the last year. A continuant publishes in all three years. Matches are newcomers, terminators or continuants in the second year of the timeframe. We extended the continuant pattern to cover the years between first appearance and termination of work (if within the filtered timeframe). Even if there are publishing free years in between, the researcher is still considered a continuant. However, if there were publishing free years, the researcher would be a match for the other two patterns, too. We chose to expand the timeframe, because tests with the CENIDE data on the TrajectoryBuilder showed that either due to missing data or research schedules, there were researchers not having published any papers within a year. To fill that gap, it can be safely assumed, that the researchers continued working on the same topic, if it was identical in the year before and after the missing year (Braun et al. 2001). The same conclusion however cannot be drawn for newcomers and terminators, since that would mean having to extrapolate forwards or backwards from the timeframe given by the input trajectory.

Figure 36. Patterns newcomer, terminator and continuant as implemented in the workbench. Grey boxes indicate the analysed timeframe, red boxes the years, in which the pattern applies.
Additionally suggested roles
The roles trendsetter, diversifier and roamer have been defined in addition to the existing patterns.
A Trendsetter is a newcomer to a new topic. He or she publishes on the topic within the first year of its appearance.
Diversifiers are researchers, who work on an extraordinarily large number of topics simultaneously. They hold a very broad based know-how and might act as mediators. The number of topics appropriate to identify a diversifier might depend on the input data. To adapt to the input data, every researcher, who publishes on more topics than the mean plus the standard deviation calculated from a random year of the dataset is considered a diversifier.
Roamers are scientists, who change institutes quickly. Roamers have high geographic mobility. The pattern is applied to a three years time window: Within that time window, every researcher that works at at least three different institutions is considered a roamer.
Working with an example in the SISOB workbench
The RolePatternFilter works on trajectories because they hold many attributes associated with the researcher plus those associated with papers as described in Deliverable D2.2.
The collection covering 18 researchers and 6 years, which is provided by the TrajectoryBuilderSimulator, is again a purely imaginary trajectory, designed to present the patterns newcomer, terminator and continuant. Therefore, analysis does not lead to any valid results. The trajectory spans the years from 2007 to 2012. The topic “genetics”, one of five topics, returns the full trajectory. The researcher Maria Gardener demonstrates the extended continuant pattern. She has published in the years 2007, 2008, 2011 and 2012. She is matching the continuant pattern from 2008 to 2011, but at the same time is detected as a newcomer in 2011 and as a terminator in 2008.
Workflow
Figure 37 shows the workflow to detect matches for role pattern within the SISOB workbench. The TrajectoryBuilderSimulator provides the trajectory, the filters are optional. Of course it is possible to look for new and retiring researchers on an unfiltered trajectory. In the context of knowledge sharing it is much more interesting to filter the input trajectory by topic as for example, a newcomer to topic “A” is probably at the same time a terminator to topic “B”. If this holds true for a significantly large number of researchers within a short time span, it indicates a shift of interest in the researcher community. The RolePatternFilter is set to find matches for the continuant pattern. Matches are downloaded via ResultDownloader.

Figure 37. Finding role patterns on trajectories in the SISOB workbench.
Matches are listed in a txt-file in the form initials, name, matching years. The file also contains name and description of the chosen pattern.

Figure 38. Matches for the pattern continuant from the test trajectory.
Future steps
The patterns Trendsetter, Diversifier and Roamer are going to be implemented for the RolePatternFilter. For Trendsetters the input trajectory should not be filtered for topics because otherwise the matching algorithm will never be able to detect the beginning of a new topic.
Roles can be considered as attributes to the researchers who matched the pattern. To use this attribute in the following analysis, it would have to be reintegrated into the original data. This leaves two possibilities: First, the matches serve as filtering instructions for the original trajectory. Second, the original trajectory is transformed into SISOB graph format by means of the TrajectoryToNet converter. The researcher nodes are then assigned a role as a property. Both possibilities require the implementation of another agent for the SISOB workbench.
References
Abramo, G., D’Angelo, C. A., Solazzi, M., 2011. A bibliometric tool to assess the regional dimension of university-industry research collaborations, in: Scientometrics, published online 20. December 2011, DOI: 10.1007/s11192-011-0577-5
Bornmann, L., Leydesdorff, L., Walch-Solimena, C., Ettl, C., 2011 Mapping excellence in the geography of science. An apporach made possible by using Scopus data.
Braun, T., Glanzel, W., Schubert, A., 2001. Publication and Cooperation Patterns of the Authors of Neuroscience Journals. Scientometrics, 51, 499-510.
Desolla Price, D., Gürsey, S., 1976. Studies in scientometrics. Part 1. Transience and continuance in scientific authorship. Internation Forum on Information and Documentation. 1, 17–24.
Glaeser, E., Kallal, H., Scheinkman, J., Shleifer, A., 1992: Growth of the cities. J. Polit Econ, 100, 1126-1152.
Klamma, R., Spaniol, M., Denev, D.,2006. PALADIN: A Pattern Based Approach to Know-ledge Discovery in Digital Social Networks. Proceedings of I-KNOW ’06 Graz, Austria, September 6 – 8
Wagner, C. S., and Leydesdorff, L., 2005. Network Structure, Self-Organization and the Growth of International Collaboration in Science. Research Policy, 34, 1608-1618.

¿Qué son las trayectorias y cuando pueden resultar útiles?
Las trayectorias ofrecen una taxonomía multidimensional que enfatiza el aspecto temporal del intercambio de conocimiento. El uso de dichas trayectorias en el workbench de SISOB aumenta las posibilidades de análisis en el citado intercambio. Al tener un formato de carácter temporal, las trayectorias albergan información sobre actores, que en este caso son investigadores e instituciones, además de artefactos, publicaciones y sus características, como la localización geográfica o los tipos de actores, que, según la trayectoria profesional, ayudan a detectar la difusión del conocimiento tras su seguimiento durante un periodo de tiempo. Estos atributos explotan la naturaleza tácita del conocimiento para encontrar su rastro. La búsqueda, clasificación y selección son tareas básicas en las trayectorias y por consiguiente, pueden convertirse en redes bipartitas para su posterior análisis.
Las trayectorias son listas de entradas (ilustración 31) que albergan la información producida durante un año acerca de un investigador ligado a una institución. Los investigadores se identifican por un número, sus iniciales y nombre. La entrada se completa con los temas de investigación y una lista de los artículos redactados durante ese año.

Ilustración 31. Puesto que iniciales y nombres no son únicos, los investigadores se distinguen por su tarjeta de identificación. Las entradas son por investigador, institución y año.
Un artículo tiene título, un resumen contiene una lista de autores y palabras clave. Esta palabras se han extraído de los resúmenes con la ayuda del KEA (Keyphrase Extraction Algorithm, en español Algoritmo de Extracción de Frases Clave) (ilustración 32) Los temas son un cúmulo de palabras clave.
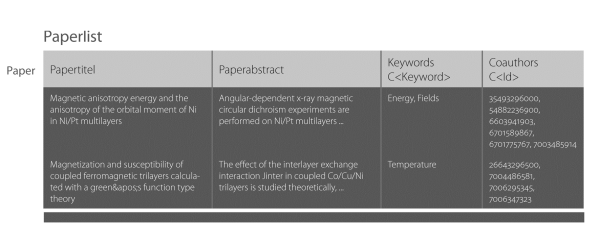
Ilustración 32. Las palabras clave se extraen de los resúmenes de las publicaciones.
Los años o instituciones que faltan se estiman a poder ser aproximadamente. Las fechas que faltan se eligen de antes y después del periodo fijado en cada entrada, y por orden cronológico. Las instituciones se extraen de las publicaciones o se asume que no se ha cambiado de institución. Todas las entradas que faltan se completan con la información curricular del año anterior. Pero incluso con estas correcciones, no puede evitarse la existencia de campos vacíos en la trayectoria si no existen datos en los que basarse.
Conversión de trayectorias a redes
Es posible convertir trayectorias a redes bipartitas en el formato Pajek-.net por medio del conversor TrajectoryToNet, en español Trayectoria a Red, en el workbench de SISOB para un análisis más detallado. Se pueden generar las siguientes redes:
- Red Autor-Institución
- Red Autor-Publicación
- Red Institución-Publicación
- Red Autor-Tema
- Red Tema-Publicación
- Red Tema-Institución
Al combinar estos grafos, se puede obtener instantáneamente, por ejemplo, redes de co-autorías.
Análisis de trayectorias – Flujo 1: La exploración del desarrollo de un único tema en un mapa de Google
El seguimiento que se hace del conocimiento se logra a menudo siguiendo los mecanismos que ayudan a difundirlo. Abramo, D’Angelo y Solazzi (2011), por ejemplo, examinaron aquellos artículos de autoría compartida con idea de hallar la difusión del conocimiento. La incorporación de esta herramienta al workbench de SISOB permite analizar el conocimiento en sí mismo, y deja para un análisis más en detalle el cómo llega hasta allí. Esto puede convertirse en una ventaja, ya que permite detectar la transferencia de conocimiento por rutas menos medibles. En este escenario, los actores son las instituciones de I+D que dan prestigio al conocimiento producido dentro de sus muros. El conocimiento viene representado por temas, descriptores extraídos de los resúmenes de las publicaciones. Aquellas instituciones que publican sobre estos temas se mapean en un mapa de Google de forma similar al enfoque adoptado por Bornmann, Leydesdorff, Walch-Solimenta y Ettl (2011), que mostraban que artículos altamente citados se sitúan en torno a las grandes ciudades. GoogleMapAgent muestra la aparición, distribución geográfica y movimiento de un tema seleccionado a lo largo del tiempo. Los años son las divisiones de tiempo consideradas. Además, es posible analizar el ciclo de vida de un tema: dónde surge, la rapidez y lugares por los que se extiende, si tiende a seguir con una institución o se mueve entre ella y con qué rapidez y dónde comienza su descenso.
Uno de los objetivos de esta herramienta es examinar dónde aparecen los temas por primera vez teniendo en cuenta que no tiene por qué tener un único origen. Incluso podría difundirse en la primera división de tiempo, o distintas instituciones podrían producir el mismo conocimiento de manera simultánea. En un mundo globalizado como el que nos encontramos, con bases de datos públicas, el Google scholar y los medios de comunicación social, los artículos, por ejemplo, están a nuestra disposición en cuestión de segundos. Pero el conocimiento es tácito por naturaleza y está estrechamente vinculado a un actor. Sería interesante ver si, bajo estas circunstancias, la afirmación de Glaeser, Kallal, Scheinkman y Schleifer (1992) de que “los avances intelectuales atraviesan pasillos y calles más fácilmente que océanos y continentes” sigue estando vigente. Finalmente este agente se puede utilizar para la detección de ciclos de vida típicos de los temas, lo que podría llevarnos al desarrollo de patrones de dichos ciclos.
Ejemplificación en el Workbench de SISOB
La colección de datos geográficos que el TrajectoryBuilderSimulator, en español Simulador de Construcción de Trayectorias proporciona para este flujo de trabajo es puramente simulada, sólo se compila con el propósito de explorar las posibilidades que ofrece el GoogleMapAgent. Por lo tanto este análisis no conduce a la obtención de resultados válidos.
La recogida consta de dieciocho entradas desde el 2009 hasta el 2012. Incluye nueve instituciones localizadas en cuatro continentes, tres de las cuales se encuentran en Boston, y dos al sur de Gran Bretaña, para cubrir así distancias de cientos a miles de kilómetros. Las instituciones son la Universidad de Duisburg-Essen, la Universidad de Harvard, El Instituto Tecnológico de Massachusetts, la Universidad de Sidney, la Universidad de Oxford, la Universidad de Cambridge, la Universidad de Zagreb, La Universidad de Boston y la Universidad de Moscú. La herramienta pone a disposición las coordenadas de estas instituciones. Hay ocho temas de donde elegir (Nano tecnología, Ingeniería Biomolecular, Bioinformática, Ciencia de Materiales, Neurociencias, Gráficos de Ordenador, Negocio Electrónico, y Análisis de Redes Sociales). La Nanotecnología aparece en cada entrada y por tanto devolverá la trayectoria completa proporcionando una demostración más clara.
Flujo de trabajo
La ilustración 33 muestra el flujo de trabajo en el workbench de SISOB. El GoogleMapAgent toma la trayectoria que proporciona como input el TrajectoryBuilderSimulator, en español Simulador de Construcción de Trayectorias. El TrajectoryFilterTime, en español el Filtro Temporal de Trayectoria, que puede aplicarse opcionalmente, reduce la trayectoria a entradas entre los años 2009 a 2012. Puesto que el GoogleMapAgent está diseñado para centrarse en un único tema de investigación, es imprescindible que el flujo de trabajo use el TrajectoryFilterTopic, en español Filtro Temático de Trayectoria para determinar el tema de interés, que para este ejemplo es “nanotecnología”. El GoogleMapAgent finalmente transfiere la información de la trayectoria al Keyhole Markup Language (kml), en español el Lenguaje de Marcado de Claves, una notación basada en XML (Lenguaje de Marcado Extensible) para información geográfica con contexto o metadatos, aceptada como input por el GoogleMap-API. El resultado es un enlace a un mapa Google que muestra una red institución-institución para el tema elegido por cada año dentro del plazo seleccionado.
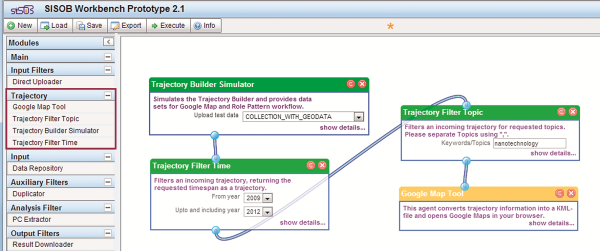
Ilustración 33. Flujo de trabajo en el workbench de SISOB que representa el desarrollo de un tema en GoogleMap.
Tal y como se aprecia en la Ilustración 34, los años se distinguen por el color de sus enlaces. Naturalmente, las redes institucionales para un año forman un grupo altamente cohesionado. Estas redes son combinaciones de redes temática-institución, que incluyen un solo tema tras el filtrado. Al combinar sobre un único tema queda un grupo de instituciones. Los enlaces se mantienen porque uno o más investigadores en la institución origen trabajan en el mismo tema que uno o más investigadores en la institución destino, pero ello no implica que exista cooperación entre dichas instituciones.
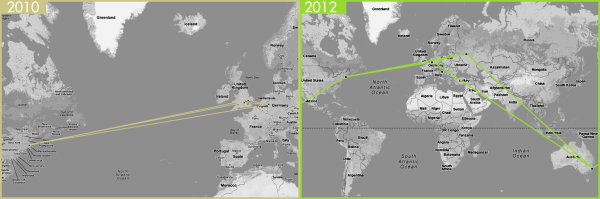
Ilustración 34. La visión de conjunto facilita una estimación aproximada del crecimiento y distribución de la red.
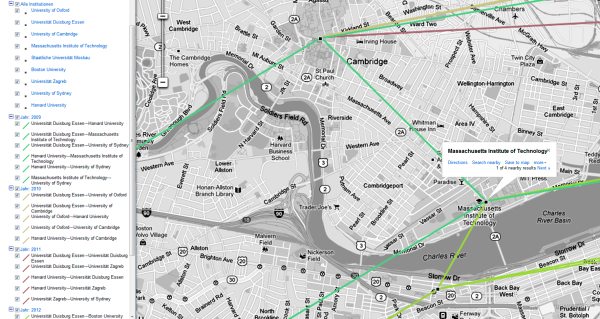
Ilustración 35. Un primer plano muestra las tres universidades de Boston que son parte de la red
Un primer plano del continente americano (ilustración 35) permite un análisis más detallado de las instituciones adheridas en esta área. Tres son las universidades en Boston que forman parte de la red. Un click en el nodo del mapa proporciona el nombre de la institución; un click en el enlace indica origen y destino. Por ejemplo, el Instituto de Tecnología de Massachusetts participó en la investigación del tema durante 2009 y 2012.
Análisis de trayectorias – Flujo 2: El hallazgo de patrones en las trayectorias
A menudo los actores desempeñan un rol en un determinado contexto. En el contexto del intercambio del conocimiento y la movilidad del investigador, estos roles resultan de especial interés si se trata de expandir el conocimiento o indicar cambios. Por lo tanto un rol se traduce en una conducta en el proceso de adquisición, creación y el compartir conocimiento. El RolePatternFilter, en español Filtro de Roles de Patrones, supone una nueva inserción en el workbench de SISOB para poder así identificar a los investigadores que ocupan roles predeterminados. Puesto que la búsqueda está automatizada, pueden acortar significativamente el proceso de búsqueda de actores significativos y servir como punto de partida para la investigación más que como resultado final (Klamma et al. 2006).
Los patrones de newcomer, en español recién llegados o incorporados, terminator, en español desvinculados y continuant, en español estables (ilustración 36) ya se han utilizado como tales puntos de partida (Braun et al. 2001, Wagner y Leydesdorff 2005). Braun et al. (2001) aplicaron estos patrones a la neurociencia y hallaron que tanto los autores incorporados como los desvinculados se unen fundamentalmente a los estables cuando se trata de compartir la autoría de un artículo y que los estables ejercen de mediadores entre los incorporados y los desvinculados.
En el documento D8.2 se mencionaba la importancia de la función del difusor del conocimiento en las redes multicisciplinares. El RolePatternFilter amplía la idea de los roles desde el clásico análisis de redes a las funciones que se derivan de las trayectorias, especialmente desde que las trayectorias se centran en el desarrollo a lo largo del tiempo. Los roles pueden atributos al actor.
Roles Implementados
Para el Workbench de SISOB se implementaron los patrones de incorporados, desvinculados y estables investigados por Braun et al. (2001) (originalmente sugeridos por Desolla Price y Gürsey 1976). Los patrones contemplan la conducta relativa a las publicaciones y se definen en un marco de tres años. Así, un autor recién incorporado no publica durante el primer año, sino durante los dos siguientes; el autor desvinculado publica los dos primeros años, pero no el tercero, mientras que el autor estable publica durante los tres años. Las coincidencias se dan por tanto en el segundo año. Ampliamos a continuación el patrón para cubrir los años entre la primera aparición y la finalización del trabajo, si se encontraban en la franja temporal que se había fijado) Incluso si no hay publicaciones en los años intermedios, el investigador sigue siendo considerado un autor estable. Sin embargo, Si no hubo publicaciones, el investigador se correspondería más con los otros patrones. Decidimos ampliar la franja temporal porque los tests con los datos de CENIDE en el TrajectoryBuilder mostraban que o debido a la pérdida de datos o a los planes de investigación, había investigadores que no habían publicado nada a lo largo de un año. Para llenar ese vacío se puede asumir con seguridad que los investigadores continuaron trabajando en el mismo tema si éste era el mismo el año anterior y posterior al año perdido (Braun et al. 2001) No se puede, sin embargo, aplicar la misma conclusión a los autores incorporados y los desvinculados, puesto que ello significaría el tener que extrapolar hacia adelante o hacia atrás desde la franja de tiempo dada por la trayectoria de partida.
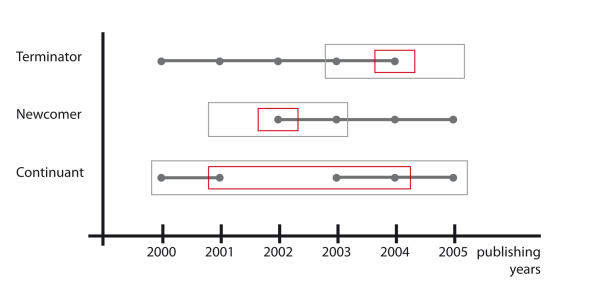
Ilustración 36. Los patrones de incorporados, desvinculados y estables tal como se aplicaron en el Workbench. Las cajas azules indican la franja temporal analizada, las rojas, los años en los que se aplica en patrón
Roles propuestos adicionalmente
Además de los patrones existentes, se han definido los de trendsetter, en español pionero o creador de tendencias, diversifier, en español diversificador y roamer, en español itinerante.
Un trendsetter es un recién llegado a un tema nuevo: él o ella publica sobre el tema durante el primer año de la aparición de éste.
Los diversifiers son investigadores que trabajan en varios temas de manera simultánea: poseen una base muy amplia del saber hacer y podrían actuar como mediadores. El número de temas necesarios para reconocer a un diversifier depende de los datos de entrada. Un investigador se considera un diversifier cuando publica en más temas que la media más la desviación normal calculada a partir de un año aleatorio del conjunto de datos.
Los roamers son científicos que cambian frecuentemente de institución, teniendo, por tanto una gran movilidad geográfica. El patrón se aplica a una ventana de tiempo de tres años: durante ese tiempo el investigador que trabaje en tres instituciones diferentes se considera un roamer.
Ejemplifcación en el workbench de SISOB
El RolePatternFilter trabaja sobre trayectorias porque éstas tienen muchos atributos relacionados con el investigador además de con artículos como ya se ha descrito en el Documento D2.2.
Los datos recogidos y proporcionados por el TrajectoryBuilderSimulator o Simulador de Construcción de Trayectorias y que incluyen a 18 investigadores y 6 años es, de nuevo, una trayectoria puramente imaginaria, diseñada para presentar los patrones de newcomer, terminator y continuant. Por lo tanto, el análisis no conduce a ningún resultado válido. La trayectoria cubre desde el año 2007 al 2012. El tema “genética”, uno de los cinco temas, devuelve la trayectoria completa. La investigadora María Gardener evidencia el patrón de estabilidad prolongada: ha publicado en los años 2007, 2008, 2011 y 2012. Se corresponde con el patrón de autora estable desde 2008 a 2011, pero al mismo tiempo es una newcomer o recién llegada en 2011 y terminator o autora desvinculada en 2008.
Flujo de trabajo
La ilustración 37 representa el flujo para la detección de coincidencias en los patrones en el workbench de SISOB. El TrajectoryBuilderSimulator ofrece la trayectoria; los filtros son opcionales. Por supuesto es posible buscar investigadores nuevos o ya retirados en una trayectoria sin filtrar En el contexto del intercambio de conocimiento resulta de mayor interés filtrar la trayectoria de input por tema. Así por ejemplo, un recién incorporado para el tema “A” es, probablemente, un desvinculado para el tema “B”. Si esto ocurre de forma significativa con un gran volumen de investigadores en un periodo corto de tiempo, indica un cambio de interés en la comunidad científica. El RolePatternFilter trata de identificar las coincidencias para todo el patrón. Las coincidencias se descargan por medio del ResultDownloader, en español Sistema de Descarga de Resultados.
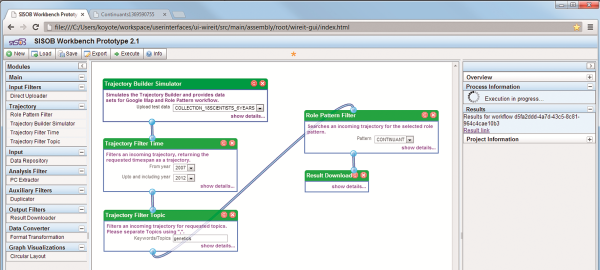
Ilustración 37. Hallazgo de patrones en las trayectorias en el workbench de SISOB
Las coincidencias se enumeran en un archivo txt con iniciales, nombre, años de coincidencia. El archivo contiene además el nombre y la descripción del patrón elegido.
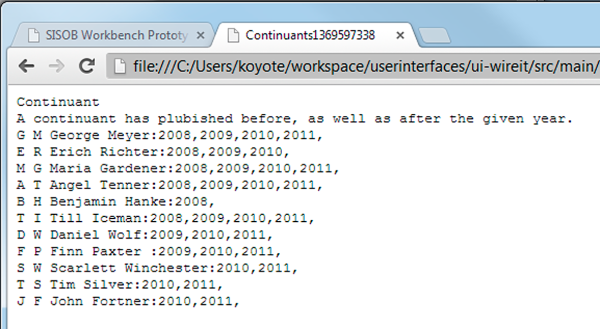
Ilustración 38. Coincidencias para el patrón tomadas de la trayectoria de pruebas
Trabajos futuros
Los patrones Trendsetter, Diversifier y Roamer se aplicarán al RolePatternFilter.La trayectoria de input para el Trendsetter no debe ser filtrada por temas, porque si no el algoritmo de coincidencia no detectará el comienzo de un tema nuevo.
Los roles se pueden considerar como atributos para los investigadores que correspondían con el patrón. Para usar este atributo en el siguiente análisis tendría que integrarse en los datos originales. Esto deja dos posibilidades: Primero, que las coincidencias sirvan como instrucciones de filtrado para la trayectoria original y, segundo, que la trayectoria original se transforme en el formato gráfico de SISOB por medio del TrajectorytoNet converter, en español, el conversor de Trayectoria a Red. A los nodos del investigador se le asignan entonces un rol como propiedad. Ambas posibilidades requieren de la aplicación de otro agente para el Workbench de SISOB.
Referencias
Abramo, G., D’Angelo, C. A., Solazzi, M., 2011. A bibliometric tool to assess the regional dimension of university-industry research collaborations, in: Scientometrics, published online 20. December 2011, DOI: 10.1007/s11192-011-0577-5
Bornmann, L., Leydesdorff, L., Walch-Solimena, C., Ettl, C., 2011 Mapping excellence in the geography of science. An apporach made possible by using Scopus data.
Braun, T., Glanzel, W., Schubert, A., 2001. Publication and Cooperation Patterns of the Authors of Neuroscience Journals. Scientometrics, 51, 499-510.
Desolla Price, D., Gürsey, S., 1976. Studies in scientometrics. Part 1. Transience and continuance in scientific authorship. Internation Forum on Information and Documentation. 1, 17–24.
Glaeser, E., Kallal, H., Scheinkman, J., Shleifer, A., 1992: Growth of the cities. J. Polit Econ, 100, 1126-1152.
Klamma, R., Spaniol, M., Denev, D.,2006. PALADIN: A Pattern Based Approach to Know-ledge Discovery in Digital Social Networks. Proceedings of I-KNOW ’06 Graz, Austria, September 6 – 8
Wagner, C. S., and Leydesdorff, L., 2005. Network Structure, Self-Organization and the Growth of International Collaboration in Science. Research Policy, 34, 1608-1618.
